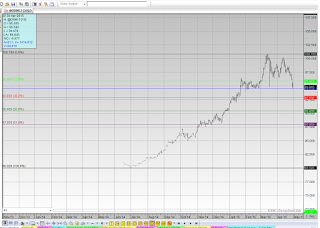
For roughly 2 years, looking from June 2012 until July 2014, the US Dollar Index stayed boxed in a 5 cent range, supported at 80.00 with resistance at 85.00. 8-months ago, the tide turned. DXM15 quietly began its 8-month, 20 cent move. 25% in 8 months turned a lot of trend followers heads. Looking at the longer term chart, you can see how the contract took 7 months between October 2014 and July 2014 building a base at 80.00. As 2014 ended, a lot of folks lookd at the 10 cent rally from 80.00 to 90.00 and decided to finally get long. After a 12-1/2 % move, the strong dollar was the trade du jour being talked about by politicians and pundits alike. Now that we’ve had our first “correction” a lot of those same “trend folllowers” have now turned into market timers trying to call the top. Friday March 13th, the Dollar posted its 12 year high, and for now, the high of the move. For a lot of bulls late to the party, that might be ironic, should the highs truly be in place. I certainly do not have a crystal ball that gives me the highs and the lows. A lot of other traders/ brokers/ advisors would lead you to believe that their next losing trade will be their first. That’s not a game I play. I do look for opportunities to place trades which I think have a good risk/reward. I believe that trade selection is secondary to trade management. Due to the vagaries of eletronic trading and HFT type algo traders out there, no matter if you are a bull or a bear, long or short, you will take heat on your position. How you manage that heat is the key. However, looking for trades, I like to look at the charts. Key points can give you entry/exit points for your trade decisions. Technical analysis always looks perfect 6-months later, looking in the mirror. The key is using tools to help you make your selections. Once those trades are in place then the focus shifts to the discipline to follow your rules. It sounds so simple, but in practice, most folks have trouble staying disciplined. Turning back to the DXM15 chart. Is yesterday’s low at 94.47, just a correction? or is it the beginning of a bigger slide? Answer? No one knows. I look to the percentage pull backs first. 1) 95.91 was the 25% retracemnt of the 6 month, 20 cent rally. 2) the much talked about 38% Fibonacci comes at 92.88 3) 92.00 is a nice round number. a test there is significant because anyone that got long the dollar on january 2nd, would then be looking at a push on their trade. 4) The 50% retracement would be next. that’ 90.43. It would take us back to the Christmas levels, which would certainly get the attention of anyone still long at that time. Am I predicting we’ll get here? Nope. I simply think that If we get a sea change and the folks who got long near the top decide they need to puke, that activity could put pressure on the Dollar. Please note, at any time, we could get a change in fundmentals, interest rates, or some geopolitical move that could re-charge the bull charge. That 100.00 level might just be too tempting an upside target long term. 2015 looks like we could have more volatile trade in the stock indexes and physical commodities as well. We have US wheat at 5-year lows. The corn and soybeans are currently under pressure too. The 12 year high in the US dollar made our wheat the most expensive on the planet. While a drop to yesterday’s 3-month low, 6.34 cents off the March high certainly helps longer term prospects for our exports, only time will tell. Watching the US dollar trade wll help you make decisions in the grain markets. A 6% correction after a 20% rally? I’ll leave it up to you to tell me if this is a break in the big trend, or the start of a new leg lower. Anyway you look at it, speculating on the direction of the US dollar index will give you plenty of opportunity. Just make sure it doesn’t turn into being the Widow Maker trade of 2015.

