How high is Too High for the Wheat?

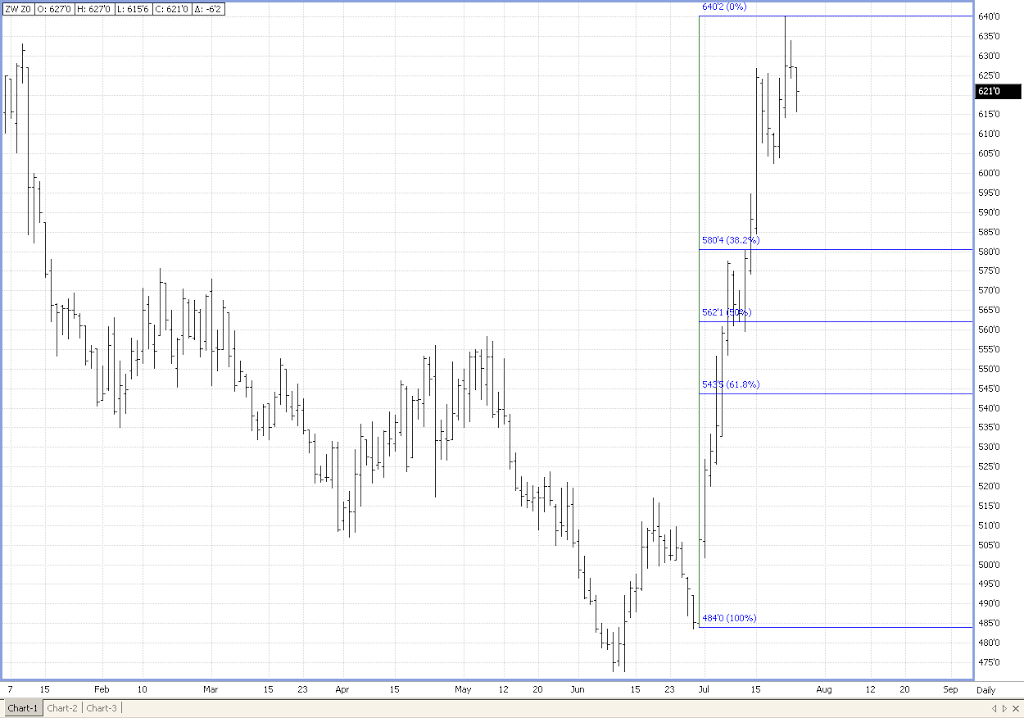
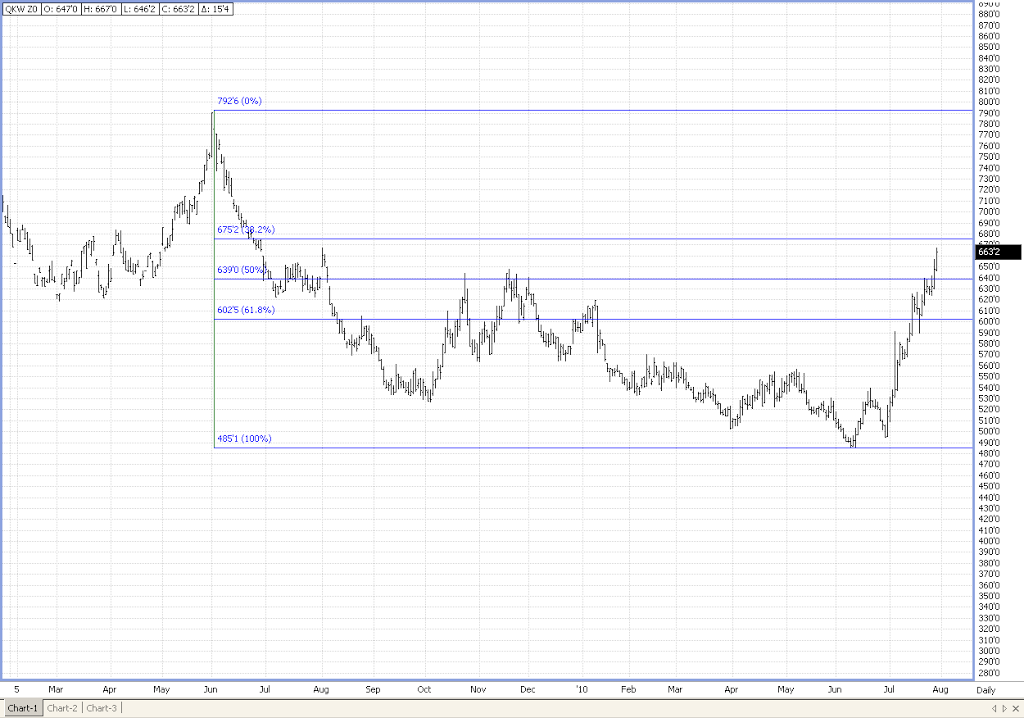
In June of 2009, Kansas City December Wheat posted a high at 7.92 3/4. 12 months and 3.08 lower, we posted our recent harvest low at 4.85. We just recently blew through the 50% retracement, at the 6.40 level. If you’ve been reading my blog, you know I like to trade with the 50% level as a target to initiate trades, both long and short.

Technically, if we settle higher here tomorrow, the last trading day of the month, and the last day of the week, we could be […]

Crude Oil Technical Head Fake

On the Fourth trading day after what looks to be a definitive bullish break out, we have the head fake. The market breaks sharply, settling below the upper trend line of the symmetrical triangle formation.

This is precisely the type of price action that goes along with technical analysis. Just as traders might have finally joined the bullish camp, looking for solid follow through to the upside, the market corrects. I would argue that after watching these markets for 22 years, moves such as this are common.

Which is […]

Crude Oil Moves Towards Major Technical levels

The above chart was a daily chart for August. August expired this week. Unfortunately, I am away for the weekend and can not access my charting software. On Monday, I will up load a chart covering the new spot month, CLQ, August.

Be that as it may, this symmetrical triangle formation is a powerful indicator. Again, I tend to lean toward the simplest, purest chart formations when looking for moves to either go with or to fade. This chart gives a graphic representation of how a trend-line acts […]

Dow Cash Approaches Key Intersection of Trend Lines


First off, if you don’t understand trendlines, go read some basic technical analysis. This entry focuses on the importance of long-term tend lines.
The two snapshots of the Dow serve as key illustrations as to the self-fulfilling nature of trend lines.

Chartists and non-chartists look at trend lines. Period. Analysts who profess to be purely fundamental, if you gave them sodium pentathol, would admit to looking at long-term trend lines.

Far […]

Spec Funds are long… are they wrong?

Commitment of trader’s report today showed funds are long 193K contracts of corn. Today’s trade watched profit taking as the weather forecast took out the premium. New crop corn (CZ) snapped to a low print of 389 1/4, 20 3/4 cents from last Tuesday’s 4 month high CZ at 410. Support lies at 384 1/2, 376 1/2 and then 368 1/2. Any one of these should be a good entry point for a trade, looking for a 5 to 10 cent bounce off of those levels. Will new crop challenge the 415 March highs? It depends on the weather forecast and the steadfastness of the […]

Rain, Rain, Stay Away…

Its the weather market of 2010. July 15th and we have our bullish scenario. Significant 66 cent rally from the June 29th contract low in Dec corn, 115 rally in old crop beans. 150 rally in new crop wheat. Certainly a gift for farmers who held out on cash sales.

As of yesterday, we had funds continuing to move towards new long positions, which is positive. Longs adding to longs, adding to previous winners, are necessary for a sustained rally.
If you are a bull, this is the type of action you want to see, as opposed to weak specs jumping on the band wagon […]